Project: DotTrack

Absolute position tracking using the raw image of a mouse sensor
Status: ongoing
Runtime: 2017 -
Participants: Andreas Schmid, Raphael Wimmer, Dennis Schüsselbauer, Laurin Muth, Thomas Fischer, Stefan Lippl
Keywords: Position, Tracking, Pattern, Mouse
Background
Tangible Blocks
Tangible blocks are small, graspable objects that can be used as input devices or as physical representations of digital data and relations. Users can move, align, rotate or stack them to interact with a computer system in a natural way. Therefore, tangibles inherently support bi-manual, eyes-free and collaborative manipulation.
Spatial Awareness
As many applications require determining the location of tangibles (“spatial awareness”), different tracking approaches have emerged over the years. Outside-in tracking techniques use external hardware, for example cameras, to determine a tangible's position. Inside-out tracking techniques on the other hand equip the tangible itself with sensors that capture properties of the environment to determine their own position. A big advantage of inside-out tracking is its robustness against occlusion, as tangible blocks are often covered by the users' hands during interaction. Additionally, no extensive external tracking infrastructure is needed.
Using a Mouse Sensor for Inside-Out Tracking
The sensor of an optical mouse is well-suited for tracking relative movements. With refresh rates of over 1000 Hz they are very fast and for short distances, they are also rather precise. Some mouse sensors like the PMW3360 can also record low-resolution images of the surface underneath them, which can be enough to detect a distinct pattern encoding a position. Other advantages of mouse sensors are their comparatively cheap price of around 10€ and their accessible interface, for example via SPI.
Goals
In the DotTrack project, we develop an inside-out tracking approach for tangible blocks using an off-the-shelf mouse sensor. Absolute positions are determined by decoding images of a dot pattern on the surface underneath the tangible. Relative movement tracked by the mouse sensor is used to interpolate between each successfully recogniced absolute position.
DotTrack aims to provide a robust and low-latency tracking infrastructure for multiple tangibles with sub-millimeter accuracy for surfaces with the size of a small table. This tracking technique can be used as a basis for applications using tangible blocks as the system knows where tangibles are, how they are positioned relative to each other, and how they are moving.

Status
Method
Pattern
We created a 8192 by 4096 binary dot pattern based on a DeBruijn torus [1] using the algorithm of Fan et al [2, 3]. Each 5 by 5 window in this pattern occurs exactly once, therefore 2^25 unique 2D positions can be encoded.
This pattern is printed with 5.9 dots per millimeter by a laser printer with at least 1200 dpi. Thus, the pattern covers a surface of 137 by 68.5 cm, which is approximately the size of a school desk (Fig. 3). The pattern can also be sliced into multiple smaller surfaces, which can for example be placed on different tables. This way, it is possible to find out on which table the tangible is.
While different types of paper lead to different recognition rates, it is also possible to print the tracking pattern on clear acrylic so any flat surface can be made trackable (Fig. 1).


Hardware
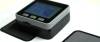
We chose the M5Stack Fire, a stackable microcontroller (ESP32) as the platform for our tangibles. It is equipped with a display, three buttons, a speaker, and several sensors out of the box, so it can be used for a wide range of applications. Furthermore, different modules can be attached to the bottom of the device in a stack.
A custom circuit board compatible with the M5Stack was built for the PMW3360 mouse sensor. The sensor is connected to the microcontroller via the SPI interface through the GPIO pins on the bottom of the M5Stack. We use the PMW3360 because it is one of the best mouse sensors on the market, well documented and, with a price of around 10€, quite affordable. Also, the PMW3360 can capture a raw sensor image with 36 by 36 pixels, whereas comparable devices have a resolution of only 24 by 24 pixels. This raw image covers an area of roughly 1 by 1 millimeter, which is 6.6 by 6.6 dots of the tracking pattern.
A 3D printed case encloses the custom board and keeps the sensor at a fixed distance from the surface. This is important as, because of the sensor's shallow depth of field, the pattern on the surface has to be exactly aligned with the focal plain to get a sharp image.
Together with a battery module, the sensor board, the bottom case and the M5Stack form a tangible block (Fig. 4).

Software
Raw images and relative movement are tracked by the mouse sensor and streamed to a host computer via WiFi. The host processes the raw image to get a binary 6 by 6 pixel array which is then searched within the DeBruijn torus. The resulting coordinates are combined with the relative movement data of the mouse sensor to calculate a final position, which is sent back to the microcontroller.
Depending on the installed demo application, the microcontroller interprets this information and shows an image on the display. The host computer can run a debug view which shows position, orientation, and a raw sensor image of all connected tangibles in a window.
Software for the M5Stack is written in Arduino C++ and all programs on the host computer are written in Python 3 to ensure maximum compatibility.
Microcontroller Program
The program on the microcontroller implements all functions documented in the PMW3360 datasheet via SPI commands.
On startup, the PMW3360 is initialized and a WiFi connection to the host PC (credentials are defined in a config file) is established.
Then, following processes run in parallel:
- Relative movement of the device is read from the mouse sensor and summed up. The result is streamed to the host PC via UDP.
- A raw 36 by 36 pixel 8 bit greyscale image is captured with the mouse sensor and sent to the host PC via TCP. The host responds with a new position of the tangible or a failed message in case calculating the position was not successful. As the readout of a sensor image is significantly faster than transferring it to the host and processing it there, this process is repeated only once an answer from the host is received. If a new position was received successfully, the current position of the tangible is updated and the buffers for relative movement are cleared.
- The demo application running on the tangible interprets the position and movement data and shows an image on the M5Stack's screen.
Image Preprocessing
Once the host computer receives a raw image from the microcontroller, it has to be converted to a 6 by 6 pixel binary array which is then searched within the DeBruijn torus.
The first step of the pipeline is a binarization of the raw 36 by 36 pixel image. First, the brightness of the raw image is normalized by setting the white point to the maximum brightness and the black point to the minimum brightness with a linear equation. This step gets rid of inconsistencies due to varying exposure times of the sensor.
Depending on the quality of the print (printer resolution and type of paper), different preprocessing steps are required. For very smooth surfaces like glossy photo paper, an adaptive mean threshold is sufficient to binarize the image and remove artifacts and luminance gradients.
Rough surfaces like ordinary printer paper require more preprocessing steps as edges are soft and there are artifacts due to reflection. Therefore, the image is first sharpened with a 3 by 3 kernel filter. Then, noise is removed with a bilateral filter. A dilation followed by an erosion removes small dark and bright spots in larger areas which might be caused by reflected infrared light or impurities of the material. A final adaptive means threshold binarizes the image. Parameters for all those preprocessing steps have been optimized for individual types of paper.
As the sensor's image is not always perfectly aligned to the dot pattern, the best alignment of a 6 by 6 grid and the binarized image has to be found. To do this, the sensor image is first extended so incomplete dots at the border can be included. Then the correct anchor point for a fixed 6 by 6 grid with a cell size equal to one dot in the image is found with a brute force method. This happens by shifting the grid over the image pixel by pixel and scaling the part of the image inside the grid down to 6 by 6 pixels (linear interpolation). Entirely black or white grid cells cause a black respectively white pixel in the resulting array, whereas partially black or white cells cause a grey pixel. The resulting array with the most completely black or white pixels is regarded as the best alignment. Remaining grey pixels with a very dark (< 80) or very bright (> 175) value are set to black/white with a fixed threshold as they are likely to be of the respective color. In case there are still grey pixels left, they are binarized by comparing the value of their grid cell in the normalized raw image with its surroundings. If the cell is brighter than the average of all surrounding cells, it is set to white, otherwise it is set to black.
This preprocessing pipeline transforms a raw 36 by 36 pixel 8 bit greyscale raw sensor image into a 6 by 6 bit array which contains four 5 by 5 windows of the DeBruijn pattern used to encode 2D positions.

DBT Search
To calculate the position of the 6 by 6 bit array within the DeBruijn torus, Fan et al.'s algorithm [2, 3] is used to decode the torus and search for each of the four 5 by 5 pixel windows contained in the bit array. As four 5 by 5 windows are contained within the 6 by 6 bit array, four positions are found within the torus. This redundancy is required for error prevention, as errors in the binarization can lead to wrong positions. By checking how many of the four decoded positions match up, a confidence value for the result is calculated:
- all four positions match up → 100% confidence.
- three of the four positions match up → 85% confidence (this means one corner pixel is flipped).
- 2 times position A and two different positions → 75% confidence (one or more pixels on a border are flipped). Position A is returned.
- 2 times position A and two times position B → 50% confidence. We cannot tell which one is correct.
- four different positions → 0% confidence. No way to tell which one is correct.
As wrongly calculated positions deteriorate a tracking system severly, we only regard 100% and 85% confidences as successful. Even though false positives for 85% confidence are theoretically possible, they have not shown up in practice during our evaluation. Therefore we assume a 85% confident position is correct.
As the DeBruijn pattern we use does not give any information about orientation, the 6 by 6 bit array is rotated in 90 degree steps and the whole decoding process is repeated for each of those four orientations. The position and orientation of the result with the highest confidence is then returned as the final position of the tangible.
Debug View
The debug visualization shows the current status of the system in real time (Fig. 6). Each tangible is represented by an image of the M5Stack whose position and orientation (a) within the window are equal to the tangible's position and orientation on the pattern. A grey “ghost” of each tangible (b) represents its last absolute position calculated via the dot pattern while the position of the colored image also incorporates the relative movement tracked by the mouse sensor. The screen of each virtual M5Stack shows the current raw image captured by its sensor (c).
On the left hand side (d), current 2D coordinates on the pattern (in millimeter) of each tangible are shown.

Demo Applications
To give example use cases for DotTrack, we implemented three demo applications.
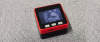
- Magnifying Glass: The raw sensor image is shown on the M5Stack's display (Fig. 7a). This can be used as a magnifying glass as a region of 1 by 1 millimeters is magnified to a size of 30 by 30 millimeters. We used this application to get an overview on how different printers and paper types influence the look of the pattern.
- Magic Lens: A small cutout of a large image is shown on the display and moves proportionally to movement of the tangible (Fig. 7b). This can be used to augment a surface with information or simply implement a “Where is Waldo?” type of game.
- Googly Eyes: An eye is shown on each of two tangible's displays. They always look in the direction of the other tangible (Fig. 7c). When both tangibles are close together, the background color changes from black to white. This application shows DotTrack's capability to support more than one tangible which know each other's position and the ability to perform actions depending on the relative position of tangibles to one another.
- Geometry: Geometric properties of the shape formed by tangibles on the table are displayed. For two tangibles, the distance between them is shown. For three tangibles, a triangle with information on edge length and inner angles is shown (Fig. 7d). This demo allows for exploring properties of geometric shapes in an educational context, or to use tangibles to measure real-world distances.
Demo applications can be implemented by modifying the program running on the microcontroller.


Evaluation
To evaluate the performance of DotTrack, we measured the success rate of different types of paper. We define the recognition of a position as successful, if the calculated position is closer than 5 millimeter to the actual position of the tangible.
For the evaluation, we collected a data set with at least 1000 images of the dot pattern for each type of paper we compared. We used a robotic arm (AxiDraw v3) to move the tangible over the surface in 2.4 millimeter steps and saved the sensor image together with its actual coordinates retrieved from the AxiDraw (Fig. 8).
Each data set was preprocessed with a pipeline optimized for the particular type of paper and positions were calculated by the algorithm described earlier (results in Fig. 9). Very smooth and glossy paper can lead to recognition rates of over 95%. Recognition rates for standard printer paper are significantly worse with about 70%, even though heavy preprocessing is required. However, this recognition rate can still be sufficient for tracking if minor stutters are acceptable.
The time needed to process an image depends on the type of computer used and ranges from about 70 to about 110 milliseconds.


Detecting the Tangible's Orientation
Our method to find a tangible's position only works if the sensor is aligned with the tracking pattern. As we can only distinguish different orientations in 90 degree steps, we have to find the angle of rotation for skewed sensor images to align the pattern with a grid. Determining the exact angle is a challenge as traditional approaches to find the orientation of a pattern, like Hough lines, do not work for resolutions as small as 36 by 36 pixels.
We solved this problem by training a convolutional neural network with 37800 senor images (1890 for each 5° step between 0 and 85°). As the model is only trained with images rotated in 5° increments, in-between angles are interpolated by calculating a weighted average of predictions for each angle. For example, if the model finds a 50\% probability for both 35° and 40°, an angle of 37.5° is reported.
After three training epochs, our model reached 92.98% accuracy on the validation data set (loss: 0.1879) and 88.77% accuracy on a separate test data set.
To evaluate our model's performance, we acquired another data set of 135 images for each 1° angle between 0° and 89° from a different area within the De-Bruijn torus.
On average, a prediction takes 0.73 milliseconds (sd: 0.23) on our test system. For evaluation images rotated in 1° increments, our model achieved a mean error rate of 1.94° (sd: 1.63, max: 13.41). However, it performed significantly better for only 5° and 10° increments.
Future Work
Next steps of the DotTrack project are to design a PCB for the PMW3360 mouse sensor, so more tangible can be produced easily. We also plan to implement more demo applications.
Old Material
Video for our MuC demo paper. The device shown in this video can distinguish between several surfaces and start different applications depending on them. By moving the device on the surface, those applications can be controlled.
References
[1] de Bruijn, N. G. (1946). A combinatorial problem. Proceedings of the Section of Sciences of the Koninklijke Nederlandse Akademie van Wetenschappen Te Amsterdam, 49(7), 758–764.
[2] Fan, C. T., Fan, S. M., Ma, S. L., & Siu, M. K. (1985). On De Bruijn arrays. Ars Combinatoria, 19(MAY), 205–213.
[3] Shiu, W.-C. (1993). Decoding de Bruijn arrays as constructed by Fan et al.
Publications
Dennis Schüsselbauer, Andreas Schmid, Raphael Wimmer, Laurin Muth
Workshopband Mensch und Computer 2018
Development of a system for tracking the 2D position of tangible blocks and their spatial relations (Tweet this with link)
![]()
![]()
Dennis Schüsselbauer, Andreas Schmid, Raphael Wimmer
Proceedings of the 2021 Conference on Tangible, Embedded, and Embodied Interaction
Accurate inside-out tracking method for tangible blocks based on a printed De-Bruijn pattern and a mouse sensor. (Tweet this with link)
![]()
![]()

Andreas Schmid, Raphael Wimmer, Stefan Lippl
ACM SIGGRAPH 2022 Posters
We trained a deep neural network to determine the orientation of a tracking pattern in sensor images with extremely low resolution. (Tweet this with link)
![]()
![]()
Resources
News / Blog
Visit by Minister-President Dr. Markus Söder (2022-05-05)
We presented current and upcoming research. (more...)
DotTrack at TEI 2021 (2021-02-16)
We will present our paper Dothraki: Tracking Tangibles Atop Tabletops Through De-Bruijn Tori at TEI 2021 conference. Further information on can be found on the DotTrack project page. (more...)
DotTrack at 'Mensch und Computer 2018' in Dresden (2018-09-02)
We will present the current state of our DotTrack project at Mensch und Computer 2018. (more...)